
Aníbal Arias
Jefe de la Unidad Coronaria. Hospital Italiano de Buenos Aires, Ciudad Autónoma de Buenos Aires, Argentina.
Coordinador: Rodolfo Pizarro
Máster en Efectividad Clínica. Jefe de Cardiología Hospital Italiano. Ciudad Autónoma de Buenos Aires, Argentina.
Acta Gastroenterol Latinoam 2021;51(1):10-11
Recibido: 25/02/2021 / Aceptado: 02/03/2021 / Publicado en www.actagastro.org el 22/03/2021 / https://doi.org/10.52787/muvp7746

Las medidas de efecto relativas expresan el evento esperado en un grupo en comparación con otro. El riesgo relativo (RR) es el cociente entre el riesgo de un evento en dos grupos, mientras que el odds ratio (OR) es el cociente del ODDS de un evento. Para ambas medidas, un valor de 1 indica que la estimación del efecto es la misma en las dos intervenciones.1 Para facilitar su comprensión, vamos a tomar, como ejemplo, los datos del estudio RALES (Randomized Aldactone Evaluation Study) que se muestran en la Tabla 1. Este fue un ensayo clínico randomizado que aleatorizó a pacientes con una insuficiencia cardíaca a espironolactona (intervención) contra un placebo (sin intervención). El punto final primario de este estudio fue la mortalidad.2 Si queremos conocer el riesgo relativo, primero debemos calcular el riesgo en el grupo expuesto o intervención, es decir, el cociente entre el número de pacientes que fallecieron en el grupo espironolactona (226) sobre el número total de pacientes con dicha droga: 822 pacientes (muertos + vivos). El resultado del cociente es 0,27; lo que equivale a decir que el riesgo de muerte en los pacientes randomizados a espironolactona fue del 27%. Luego, repetimos el mismo procedimiento para calcular el riesgo de muerte en los pacientes del grupo placebo: 314/841 = 0,37. El riesgo de muerte en el grupo placebo fue del 37%. Finalmente, para calcular el RR hay que efectuar el cociente entre el riesgo de muerte en el grupo espironolactona sobre el riesgo de muerte en el placebo: 0,27/0,37 = 0,72. Un riesgo relativo de 0,72 significa que, en la IC, la espironolactona (en comparación con el placebo) reduce un 28% la mortalidad. Si ahora nos interesa calcular el OR, primero es necesario conocer el ODDS en el grupo espironolactona y luego, en el placebo. Para el primer paso, el cociente sería 226/596 = 0,37; y para el segundo, 314/527 = 0,59. El OR es la división de ambos: 0,37/0,59 = 0,62. Un OR de 0,62 se interpreta así: por cada 0,62 muertes que se producen con espironolactona, ocurre 1 muerte con placebo o cada 62 muertes que hay con espironolactona, ocurren 100 con placebo.
Tabla 1. Tabla de 2 x 2 que muestra la mortalidad en los pacientes con espironolactona vs. con un placebo.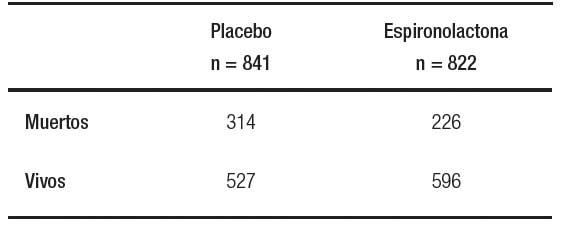
En la Tabla 2, se muestran datos del estudio PARTNER con seguimiento a 2 años, que aleatorizó a pacientes con estenosis aórtica severa y un alto riesgo quirúrgico a TAVR (Transcatheter aortic-valve replacement) o manejo estándar. El evento primario se definió como muerte y reinternaciones.3 Siguiendo los mismos pasos del ejemplo anterior, si calculamos el RR y el OR, los resultados son 0,60 y 0,31. Como se observa, las medidas de efecto son muy similares en el ejemplo de la espironolactona y muy distintas en el caso del estudio de intervención percutánea de la válvula aórtica. Es importante destacar que, cuando el evento en cuestión es frecuente, el OR sobrestima el efecto y es conveniente expresar los datos como un RR.4
Tabla 2. Tabla de 2 x 2 que registra un evento combinado de muerte o reinternación en pacientes con TAVR vs. con un placebo.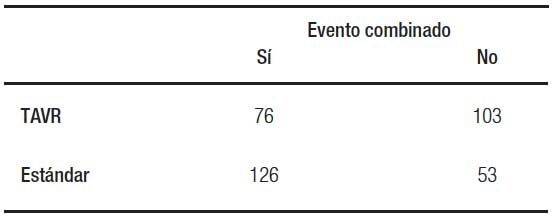
Aviso de derechos de autor © 2021 Acta Gastroenterológica Latinoamericana. Este es un artículo de acceso abierto publicado bajo los términos de la Licencia Creative Commons Attribution (CC BY-NC-SA 4.0), la cual permite el uso, la distribución y la reproducción de forma no comercial, siempre que se cite al autor y la fuente original.
Cite este artículo como: Arias A. Medidas de efecto: ¿cómo las interpretamos desde la evidencia? Acta Gastroenterol Latinoam. 2021;51(1):10-1. https://doi.org/10.52787/muvp7746
Referencias
- Higgins JPT, Li T, Deeks JJ. Chapter 6: Choosing effect measures and computing estimates of effect. En: Higgins JPT, Thomas J, Chandler J, Cumpston M, Li T, Page MJ, Welch VA (editores). Cochrane Handbook for Systematic Reviews of Interventions version 6.2. 2021.
- Pitt B, Zannad F, Remme WJ, Cody R, Castaigne A, Perez A et al. The effect of spironolactone on morbidity and mortality in patients with severe heart failure. Randomized Aldactone Evaluation Study Investigators. N Engl J Med. 1999;341(10):709-17.
- Makkar RR, Fontana GP, Jilaihawi H, Kapadia S, Pichard AD, Douglas PS et al. Transcatheter aortic-valve replacement for inoperable severe aortic stenosis. N Engl J Med. 2012;366(18):1696-704.
- Sedgwick P. Relative risks versus odds ratios. BMJ 2014;348:g1407.
Correspondencia: Aníbal Arias
Correo electrónico: anibal.arias@hospitalitaliano.org.ar
Acta Gastroenterol Latinoam 2021;51(1):10-11
Measures of Effect: How Do We Interpret It from Evidence?
Aníbal Arias
Head of Coronary Unit, Hospital Italiano de Buenos Aires. Ciudad Autónoma de Buenos Aires, Argentina.
Coordinator: Rodolfo Pizarro
Master in Clinical Effectiveness. Head of Cardiology, Hospital Italiano de Buenos Aires. Ciudad Autónoma de Buenos Aires, Argentina
Acta Gastroenterol Latinoam 2021;51(1):12-13
Received: 25/02/2021 / Accepted: 02/03/2021 / Published in www.actagastro.org on 22/03/2021 / https://doi.org/10.52787/muvp7746
Relative effect measures express the expected event in one group compared to another group. The relative risk (RR) is the ratio between the risk of an event in two groups, while the odds ratio (OR) is the ratio of the ODDS of an event. For both measures, a value of 1 indicates that the estimate of the effect is the same in the two interventions.1 For ease of understanding, we will take as an example the data from the RALES study (Randomized Aldactone Evaluation Study) shown in Table 1. This was a randomized clinical trial that randomized patients with a heart failure to spironolactone (intervention) versus a placebo (without intervention). The primary endpoint of this study was the mortality.2 If we want to know the relative risk, we must first calculate the risk in the exposed or intervention group, that is, the ratio between the number of patients who died in the spironolactone group (226) over the total number of patients treated with this drug: 822 patients (dead + alive). The result of the ratio is 0.27, which is equivalent to saying that the risk of death in patients randomized to spironolactone was 27%. Then, we repeated the same procedure to calculate the risk of death in the patients in the placebo group: 314/841 = 0.73. The risk of death in the placebo group was 37%. Finally, to calculate the RR, the ratio of the risk of death in the spironolactone group over the risk of death in the placebo group was 0.27/0.37 = 0.72. A relative risk of 0.72 means that, in HF, spironolactone (compared to placebo) reduces mortality by 28%. If we are now interested in calculating the OR, it is first necessary to know the ODDS in the spironolactone group and then in the placebo group. For the first step, the ratio would be 226/596 = 0.37 and for the second, 314/527 = 0.59. The OR is the division of both, 0.37/0.59 = 0.62. An OR of 0.62 is interpreted as that for every 0.62 deaths that occur with spironolactone, 1 death occurs with placebo or every 62 deaths that occur with spironolactone, 100 occur with placebo.
Table 1. 2 x 2 table showing the mortality in the patients with spironolactone vs. with a placebo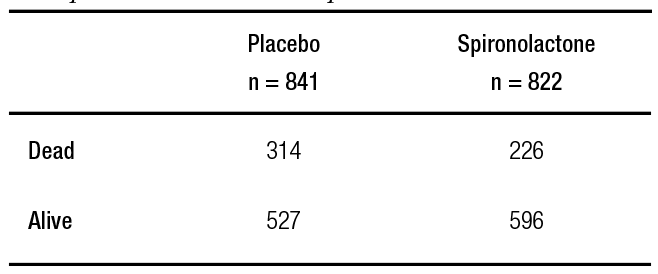
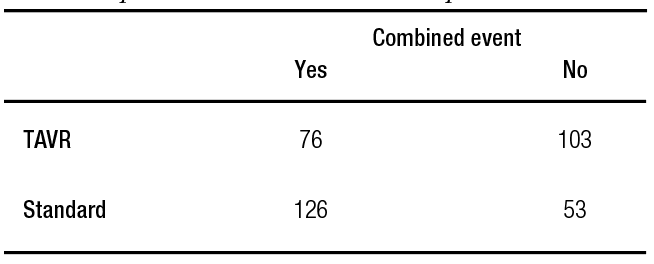
Table 2 shows data from the PARTNER study with a 2-year follow-up, which randomized patients with severe aortic stenosis and high surgical risk to TAVR (Transcatheter aortic-valve replacement) or standard management. The primary event was defined as death and rehospitalizations.3 Following the same steps as in the previous example, if we calculate the RR and the OR, the results are 0.60 and 0.31. As can be seen, the effect measures are very similar in the spironolactone example and very different in the case of the percutaneous aortic valve intervention study. It is important to note that, when the event in question is frequent, the OR overestimates the effect and it is convenient to express the data as a RR.4
Table 2. 2 x 2 table that records a combined event of death or rehospitalizations in patients with TAVR vs. a placebo
Copyright © 2021 Acta Gastroenterológica latinoamericana. This is an openaccess article released under the terms of the Creative Commons Attribution (CC BY-NCSA 4.0) license, which allows non-commercial use, distribution, and reproduction provided the original author and source are acknowledged.
Cite this article as: Arias A. Measures of Effect: How Do We Interpret It from Evidence? Acta Gastroenterol Latinoam. 2021;51(1):12-3. https://doi.org/10.52787/muvp7746
References
- Higgins JPT, Li T, Deeks JJ. Chapter 6: Choosing effect measures and computing estimates of effect. En: Higgins JPT, Thomas J, Chandler J, Cumpston M, Li T, Page MJ, Welch VA (editores). Cochrane Handbook for Systematic Reviews of Interventions version 6.2. 2021.
- Pitt B, Zannad F, Remme WJ, Cody R, Castaigne A, Perez A, et al. The effect of spironolactone on morbidity and mortality in patients with severe heart failure. Randomized Aldactone Evaluation Study Investigators. N Engl J Med. 1999;341(10):709-17.
- Makkar RR, Fontana GP, Jilaihawi H, Kapadia S, Pichard AD, Douglas PS, et al. Transcatheter aortic-valve replacement for inoperable severe aortic stenosis. N Engl J Med. 2012;366(18):1696-704.
- Sedgwick P. Relative risks versus odds ratios. BMJ 2014;348:g1407.
Correspondence: Aníbal Arias
Email: anibal.arias@hospitalitaliano.org.ar
Acta Gastroenterol Latinoam 2021;51(1):12-13