Emiliano Rossi ID
Médico cardiólogo. Departamento de Investigación. Hospital Italiano de Buenos Aires.
Ciudad Autónoma de Buenos Aires, Argentina.
Acta Gastroenterol Latinoam 2023;53(4):331-333
Recibido: 14/11/2023 / Aceptado: 19/12/2023 / Publicado online el 29/12/2023 / https://doi.org/10.52787/agl.v53i4.365

En los estudios clínicos en los que interesa observar la presentación de nuevos eventos durante el periodo de seguimiento habitualmente se considera el tiempo transcurrido hasta la ocurrencia del primer evento. Si el primer evento es no fatal, este enfoque implica que se perderá la información de los eventos subsiguientes. Sin embargo, cuando es de interés capturar el efecto del tratamiento sobre la carga total de enfermedad, conviene incluir los eventos recurrentes en el análisis. Se consideran eventos recurrentes todos aquellos que los investigadores hayan definido como puntos finales y se presenten a partir de un primer evento. Son ejemplos de ellos las reinternaciones, la realización de algún procedimiento, el empeoramiento clínico y la muerte durante el seguimiento.
Existen distintos métodos estadísticos que permiten analizar los eventos recurrentes en el contexto de los ensayos clínicos.1-2 Los más difundidos en la actualidad son (Tabla 1):
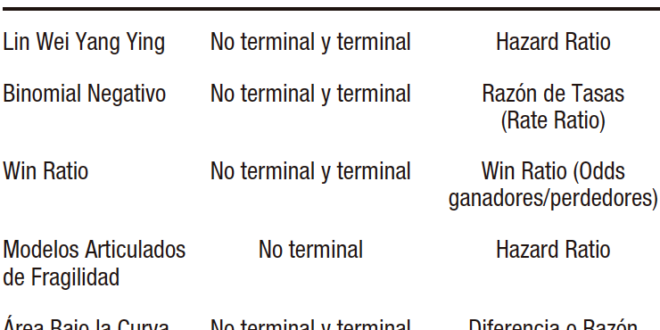
Tabla 1. Métodos estadísticos para analizar eventos recurrentes
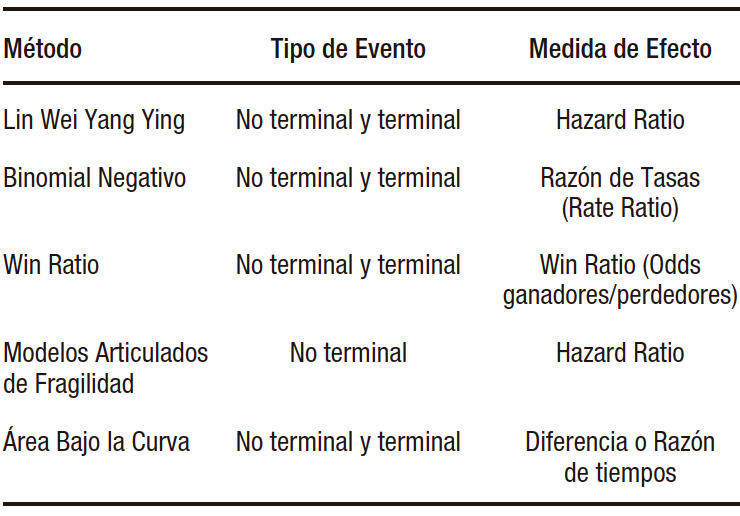
a) El modelo de Lin Wei Yang Ying (LWYY). Es una extensión del modelo de Cox. Tiene la ventaja de permitir modelar eventos que no son independientes, ya que considera el agrupamiento de los eventos en pacientes de alto riesgo. También permite modelar eventos terminales, es decir aquellos a partir de los cuales los individuos ya no estarán en riesgo (ej. muerte). Sus desventajas son que asume censura no informativa entre los eventos (la falta de información de sobrevida de un evento no se relaciona con otro) y que asume proporcionalidad de los hazard ratios durante todo el periodo de seguimiento.
b) El modelo binomial negativo. Es una extensión del modelo de Poisson. Su ventaja con respecto a este es que suaviza algunas de sus asunciones, como tener una tasa de eventos fija durante el seguimiento y tener la misma tasa de eventos en todos los individuos. Permite estimar y comparar tasas de incidencia. Al igual que el modelo de LWYY, permite modelar eventos terminales y tiene como desventaja el asumir censura no informativa entre los eventos.
c) Win Ratio. Es un método que permite incluir eventos recurrentes jerarquizando los componentes del punto final. Compara mediante pareamiento a cada paciente del grupo de intervención con todos los del grupo control. En cada par control-intervención se evalúa la incidencia de los componentes del punto final en orden descendente de importancia (ej. 1º muerte, 2º hospitalización, 3º mejoría en una escala de calidad de vida) y el resultado en cada par será victoria, pérdida o empate. El Win Ratio se calcula como el número total de victorias sobre el total de pérdidas del grupo de intervención. Si toma un valor mayor a la unidad, el resultado es en favor de la intervención. Si el efecto se quiere comparar con el estimado por otras medidas como el riesgo relativo o el hazard ratio, se debe expresar como 1/Win Ratio.
d) Modelos articulados de fragilidad. Permiten estimar el riesgo de eventos recurrentes en presencia de un evento terminal, aunque sólo estiman el hazard ratio de los eventos no fatales; es decir, no permiten incluir eventos terminales en el punto final combinado. Calculan el riesgo de presentar eventos recurrentes dada la coexistencia del riesgo de ocurrencia de un evento terminal. En la mayoría de situaciones clínicas los pacientes con alto riesgo de eventos no fatales tienen mayor riesgo de presentar un evento fatal.
e) Área bajo la curva (ABC). Es una extensión de tiempo de sobrevida media restringida. Tiene como ventaja que no posee asunciones estadísticas y como desventaja que se debe establecer un periodo fijo de seguimiento, por lo que no se tendrán en cuenta los eventos ocurridos con posterioridad. El ABC estima para cada evento el tiempo transcurrido entre el evento y la fecha de fin de seguimiento («tiempo perdido»). Posteriormente, suma estos tiempos en cada paciente y los promedia en cada grupo del estudio. Se puede presentar en forma absoluta como la diferencia de tiempos o en forma relativa como razón de tiempos entre los grupos intervención y control. El promedio evento-tiempo es igual al ABC de incidencia acumulada de eventos. Se debe tener en cuenta que los eventos que ocurren tardíamente durante el seguimiento contribuyen poco en su estimación.
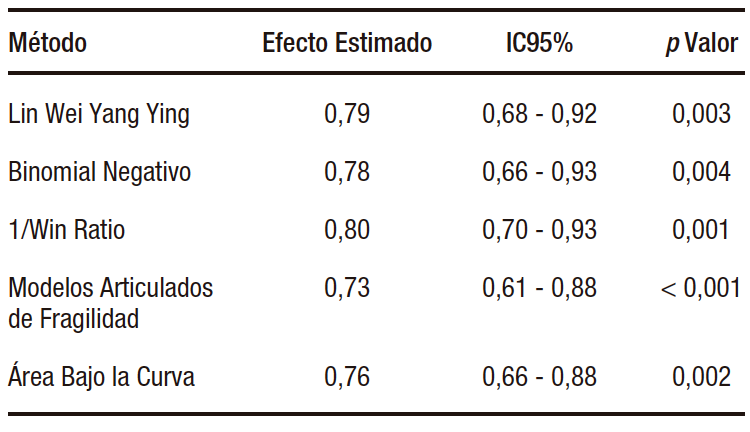
Recientemente Gregson y col. publicaron una revisión sobre la metodología de análisis de eventos recurrentes.1 En ella compararon los resultados de aplicar los métodos mencionados a los datos de distintos ensayos clínicos cardiovasculares. En el estudio EMPEROR-Preserved, en el que pacientes con insuficiencia cardíaca y fracción de eyección preservada fueron asignados aleatoriamente para recibir empaglifozina (n=2.997) o placebo (n=2.991) y cuyo punto final primario fue la incidencia de muerte por causa cardiovascular o internaciones por insuficiencia cardíaca, se observó un total de 1.411 eventos (463 muertes y 948 internaciones por insuficiencia cardíaca).3 De ellos, 926 fueron primeros eventos y 485 eventos recurrentes. Como ocurre habitualmente en la clínica, la mayoría de los pacientes tuvieron un único evento o ninguno, y sólo unos pocos pacientes tuvieron varios. Se observó que la rama de tratamiento activo presentó menor cantidad de eventos comparada con la rama de control. En la Tabla 2 se presentan las medidas de efecto y sus correspondientes intervalos de confianza para cada uno de los métodos descriptos. En este caso los resultados fueron semejantes. En otras situaciones, dependiendo de la naturaleza de los eventos en estudio y de los supuestos de los modelos, los resultados pueden ser discordantes.
Tabla 2. Comparación de efectos estimados por distintos métodos de análisis de eventos recurrentes en el estudio EMPEROR-Preserved
Algunas consideraciones para tener en cuenta al momento de elegir un método de análisis para estudios cuyo objetivo sea evaluar la ocurrencia de eventos durante el seguimiento:
• En pacientes sin enfermedad establecida, el objetivo principal del tratamiento es prevenir la aparición de la enfermedad. En este caso el análisis del tiempo hasta el primer evento es una opción adecuada (ej. Modelo de Cox).
• En pacientes con una enfermedad crónica, el objetivo principal del tratamiento es reducir el número total de eventos durante el seguimiento. Aquí son más útiles los análisis que incluyan eventos recurrentes.
• En pacientes con una enfermedad en etapa avanzada, la calidad de vida es relevante. El Win Ratio permite combinar las medidas de calidad de vida con la incidencia de eventos fatales y no fatales.
Propiedad intelectual. El autor declara que los datos y las tablas presentes en el manuscrito son originales y se realizaron en su institución perteneciente.
Financiamiento. El autor declara que no hubo fuentes de financiación externas.
Conflicto de interés. El autor declara no tener conflictos de interés en relación con este artículo.
Aviso de derechos de autor

© 2023 Acta Gastroenterológica Latinoamericana. Este es un artículo de acceso abierto publicado bajo los términos de la Licencia Creative Commons Attribution (CC BY-NC-SA 4.0), la cual permite el uso, la distribución y la reproducción de forma no comercial, siempre que se cite al autor y la fuente original.
Cite este artículo como: Rossi E. Introducción al análisis de eventos recurrentes en estudios clínicos. Acta Gastroenterol Latinoam. 2023;53(4):331-333. https://doi.org/10.52787/agl.v53i4.365
Referencias
- Gregson J, Stone GW, Bhatt DL, Packer M, Anker SD, Zeller C, Redfors B, Pocock SJ. Recurrent Events in Cardiovascular Trials: JACC State-of-the-Art Review. J Am Coll Cardiol. 2023 Oct 3;82(14):1445-1463. DOI: 10.1016/j.jacc.2023.07.024
- Arno Fritsch, Patrick Schlömer, Franco Mendolia, Tobias Mütze, Antje Jahn- Eimermacher & on behalf of the Recurrent Event Qualification Opinion Consortium (2021): Efficiency Comparison of Analysis Methods for Recurrent Event and Time-to-First Event Endpoints in the Presence of Terminal Events-Application to Clinical Trials in Chronic Heart Failure, Statistics in Biopharmaceutical Research, DOI: 10.1080/19466315.2021.1945488
- Anker SD, Butler J, Filippatos G, Ferreira JP, Bocchi E, Böhm M, Brunner-La Rocca HP, Choi DJ, Chopra V, Chuquiure-Valenzuela E, Giannetti N, Gomez-Mesa JE, Janssens S, Januzzi JL, Gonzalez-Juanatey JR, Merkely B, Nicholls SJ, Perrone SV, Piña IL, Ponikowski P, Senni M, Sim D, Spinar J, Squire I, Taddei S, Tsutsui H, Verma S, Vinereanu D, Zhang J, Carson P, Lam CSP, Marx N, Zeller C, Sattar N, Jamal W, Schnaidt S, Schnee JM, Brueckmann M, Pocock SJ, Zannad F, Packer M; EMPEROR-Preserved Trial Investigators. Empagliflozin in Heart Failure with a Preserved Ejection Fraction. N Engl J Med. 2021 Oct 14;385(16):1451-1461. DOI: 10.1056/NEJMoa2107038
Correspondencia: Emiliano Rossi
Correo electrónico: emiliano.rossi@hospitalitaliano.org.ar
Acta Gastroenterol Latinoam 2023;53(4):331-333
Introduction to the Analysis of Recurrent Events in Clinical Trials
Emiliano Rossi ID
Cardiologist. Research Department. Hospital Italiano de Buenos Aires.
Ciudad Autónoma de Buenos Aires, Argentina.
Acta Gastroenterol Latinoam 2023;53(4):334-336
Received: 14/11/2023 / Accepted: 19/12/2023 / Published online 29/12/2023 /
https://doi.org/10.52787/agl.v53i4.365
In clinical trials where the aim lies in observing the occurrence of new events during the follow-up period, the main focus is usually on the time elapsed until the initial event occurs. If this initial event is non-fatal, adopting this approach means that information from subsequent incidents will be lost. However, when capturing the effect of treatment on the total burden of disease is of interest, it is recommended to include recurrent events into analysis. Recurrent events are defined as endpoints that occur after the initial event, as determined by researchers. Examples include readmissions, undergoing specific procedures, clinical worsening, and death during the follow-up period.
There are different statistical methods available to analyze recurrent events in the context of clinical trials.1-2 Those most widely currently used ones are (Table 1):
Table 1. Statistical methods to analyze recurrent events
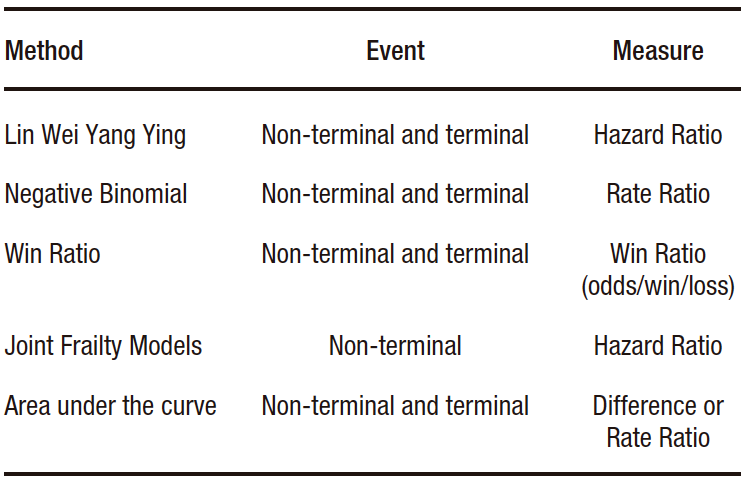
a) The Lin Wei Yang Ying (LWYY) model. It is an extension of the Cox model. It offers the advantage of allowing events that are not independent to be modeled, since it considers the grouping of events in high-risk patients. It also allows modeling terminal events, that is, those after which individuals are no longer at risk (e.g. death). Its disadvantages include assuming non-informative censoring between events (the absence of survival information for one event is unrelated to another) and assuming proportional hazard ratios for the entire follow-up period.
b) The negative binomial model. It is an extension of the Poisson model. Its advantage over it is that it relaxes some of its assumptions, such as having a fixed event rate during the follow-up period, and having the same event rate in all individuals. It allows for estimating and comparing incidence rates. Similar to the LWYY model, it enables the modeling of terminal events but assumes non-informative censorship between events as a disadvantage.
c) Win Ratio. It is a method that allows including recurring events by ranking the components of the endpoint. It compares, through matching, each patient in the intervention group with those in the control group. In each control-intervention pair, the incidence of the components of the endpoint is evaluated in descending order of importance (e.g. 1st: death, 2nd: hospitalization, 3rd: improvement on a quality of life scale), and the result in each pair is categorized as “win”, “loss” or “draw”. The Win Ratio is calculated as the total number of wins over the total losses of the intervention group. If value is greater than one, the result is in favor of the intervention. If the effect is to be compared with that estimated by other measures, such as relative risk or hazard ratio, it should be expressed as 1/Win Ratio.
d) Joint Frailty Models. They allow estimating the risk of recurrent events in the presence of a terminal event, although they only estimate the hazard ratio of non-fatal events. In other words, they do not allow terminal events to be included in the combined endpoint. They calculate the risk of experiencing recurrent events considering the coexistence of the risk of the occurrence of terminal event. In most clinical situations, patients at high risk of non-fatal events are at greater risk of experiencing a fatal event.
e) Area under the curve (AUC). It is a restricted mean survival time extension. Its advantage lies in its lack of statistical assumptions. Its disadvantage is that a fixed monitoring period must be established, so events that occur subsequently will not be taken into account. The AUC estimates the time elapsed between the event and the end date of monitoring («lost time»), for each event. Subsequently, these times are added in each patient and averaged in each study group. It can be presented in absolute form, as the difference in time, or in relative form, as a ratio of time between the intervention and control groups. The event-time average equals the area under the cumulative incidence curve of events. It should be considered that events occurring late during follow-up contribute minimally to its estimation.
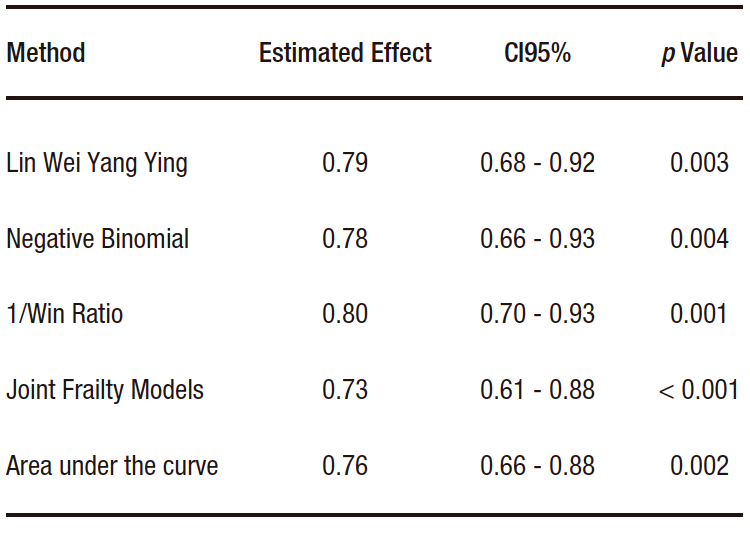
Gregson et al. recently published a review on the methodology for analyzing recurrent events.1 They compare the results of applying the aforementioned methods to data from different cardiovascular clinical trials. For example, in the case of the EMPEROR-Preserved study, which was a study that randomized patients with heart failure and preserved ejection fraction to receive empaglifozin (n=2,997) or placebo (n=2,991) and whose primary endpoint was the incidence of cardiovascular death or hospitalizations due to heart failure, a total of 1,411 events were observed (463 deaths and 948 hospitalizations due to heart failure).3 Among these, 926 were first events, and 485 were recurrent events. As usually observed in clinical settings, most patients experienced either one event or none. Only a few had several events. It was observed that the active treatment arm presented a lower number of events compared to the control arm. Table 2 presents the effect measures and their corresponding confidence intervals for each of the methods described. In this case, the results were similar. In other situations, depending on the nature of the events under study and the assumptions of the models, the results may differ.
Table 2. Comparison of effects estimated by different methods of analysis of recurrent events in the EMPEROR-Preserved study
Some considerations to take into account when choosing an analysis method for studies aimed at evaluating the occurrence of events during follow-up:
• In patients without established disease, the main goal of treatment is to prevent the onset of the disease. Therefore, the analysis of time until the first event is an appropriate option (e.g. Cox model).
• In patients with a chronic disease, the main goal of treatment is to reduce the total number of events during the follow-up period. Analyses that include recurring events are more useful.
• In patients with advanced-stage disease, quality of life is relevant. The Win Ratio allows quality of life measures to be combined with the incidence of fatal and non-fatal events.
Intellectual Property. The author declares that the data and tables presented in the manuscript are original and were carried out at his belonging institution.
Funding. The author declares that there were no external sources of funding.
Conflict of interest. The author declares that he has no conflicts of interest in relation to this article.
Copyright
© 2023 Acta Gastroenterológica latinoamericana. This is an open-access article released under the terms of the Creative Commons Attribution (CC BY-NC-SA 4.0) license, which allows non-commercial use, distribution, and reproduction, provided the original author and source are acknowledged.
Cite this article as: Rossi E. Introduction to the Analysis of Recurrent Events in Clinical Trials. Acta Gastroenterol Latinoam. 2023;53(4):334-336. https://doi.org/10.52787/agl.v53i4.365
References
- Gregson J, Stone GW, Bhatt DL, Packer M, Anker SD, Zeller C, Redfors B, Pocock SJ. Recurrent Events in Cardiovascular Trials: JACC State-of-the-Art Review. J Am Coll Cardiol. 2023 Oct 3;82(14):1445-1463. DOI: 10.1016/j.jacc.2023.07.024
- Arno Fritsch, Patrick Schlömer, Franco Mendolia, Tobias Mütze, Antje Jahn- Eimermacher & on behalf of the Recurrent Event Qualification Opinion Consortium (2021): Efficiency Comparison of Analysis Methods for Recurrent Event and Time-to-First Event Endpoints in the Presence of Terminal Events-Application to Clinical Trials in Chronic Heart Failure, Statistics in Biopharmaceutical Research, DOI: 10.1080/19466315.2021.1945488
- Anker SD, Butler J, Filippatos G, Ferreira JP, Bocchi E, Böhm M, Brunner-La Rocca HP, Choi DJ, Chopra V, Chuquiure-Valenzuela E, Giannetti N, Gomez-Mesa JE, Janssens S, Januzzi JL, Gonzalez-Juanatey JR, Merkely B, Nicholls SJ, Perrone SV, Piña IL, Ponikowski P, Senni M, Sim D, Spinar J, Squire I, Taddei S, Tsutsui H, Verma S, Vinereanu D, Zhang J, Carson P, Lam CSP, Marx N, Zeller C, Sattar N, Jamal W, Schnaidt S, Schnee JM, Brueckmann M, Pocock SJ, Zannad F, Packer M; EMPEROR-Preserved Trial Investigators. Empagliflozin in Heart Failure with a Preserved Ejection Fraction. N Engl J Med. 2021 Oct 14;385(16):1451-1461. DOI: 10.1056/NEJMoa2107038
Correspondence: Emiliano Rossi
Email: emiliano.rossi@hospitalitaliano.org.ar
Acta Gastroenterol Latinoam 2023;53(4):334-336