Diego Pérez de Arenaza ID
Jefe de Sección de Imágenes Cardiovasculares del Servicio Cardiología, Hospital Italiano de Buenos Aires.
Ciudad Autónoma de Buenos Aires, Argentina.
Acta Gastroenterol Latinoam 2022;52(2):115-119
Recibido: 03/05/2022 / Aceptado: 05/06/2022 / Publicado online: 27/06/2022 / https://doi.org/10.52787/agl.v52i2.206
Muchos eventos –médicos, políticos y sociales– poseen múltiples causas, muchas de las cuales se relacionan unas con otras.
El análisis multivariado es una herramienta estadística para determinar la contribución relativa de diferentes causas a un determinado evento o resultado. Los investigadores clínicos necesitan este tipo de análisis, dado que las enfermedades presentan múltiples causas y el pronóstico se determina, usualmente, por un gran número de factores.
Esta herramienta va a ser aplicada en dos escenarios clínicos mediante dos ejemplos.
Ejemplo 1
En la enfermedad coronaria concurren varios factores, como el tabaquismo, la hipertensión arterial, la dislipemia, la diabetes y el antecedente coronario, que se asocian al infarto agudo de miocardio.
Hay que notar que estos factores no causan el infarto de miocardio, sino que se asocian a él.
La causalidad se basa en la plausibilidad biológica y en diseños rigurosos de estudio, como los estudios aleatorizados, que eliminan las fuentes potenciales de sesgo.
Sin embargo, la identificación de factores de riesgo asociados con el evento, a través de estudios observacionales, es particularmente importante, ya que no se puede aleatorizar a personas con diferentes condiciones que causan el infarto de miocardio.
A su vez, estas condiciones se asocian conjuntamente, ya que un paciente fumador puede ser hipertenso y presentar antecedentes coronarios.
En nuestra base de infarto agudo de miocardio (IAM), el objetivo es evaluar si la insuficiencia cardíaca (ICC) se asocia en forma independiente a la muerte en esta población de pacientes.
Lo que deseamos saber es si la ICC durante la internación contribuye en forma independiente a la mortalidad en el infarto agudo de miocardio.
La Tabla 1 compara las características de los pacientes que fallecieron vs. los que sobrevivieron en el post-IAM.
Tabla 1. Características basales de los pacientes que sobrevivieron y de los que fallecieron en el IAM
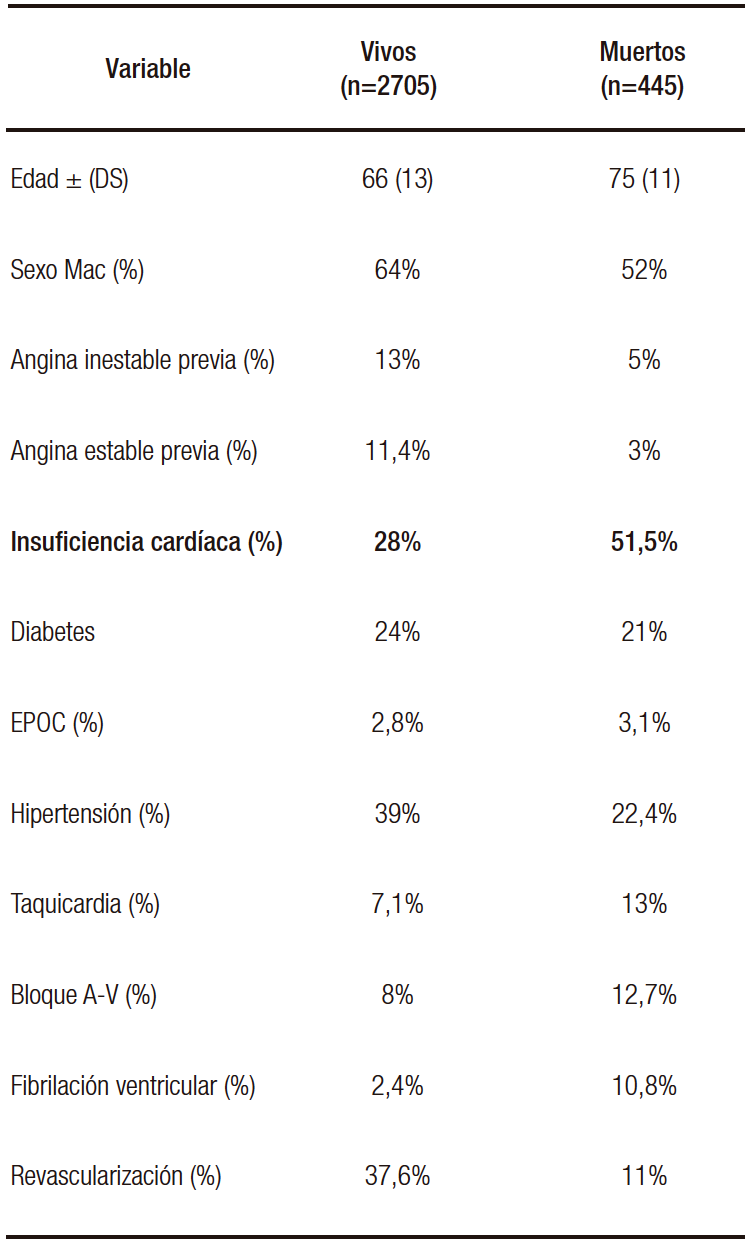
Podemos ver que hay muchas diferencias entre los grupos: los pacientes que fallecen son más añosos, presentan mayor porcentaje de ICC, episodios de taquicardia ventricular, bloqueo A-V y fibrilación ventricular.
Si observamos la Tabla 1, nos indica que los pacientes que padecen ICC post-IAM presentan una mayor mortalidad con respecto a los que no la presentan (51% vs. 28%).
Sin embargo, no nos responde la pregunta inicial acerca de la contribución independiente de la ICC, ya que solo se analiza la relación de la variable con el evento (análisis univariado) y no con los demás factores del estudio.
Por lo tanto, necesitamos el análisis multivariado para responder la pregunta en cuestión.
En la Tabla 2 se expresan los resultados del análisis multivariado en el que se ajusta el peso de esa variable con respecto a los demás factores.
Tabla 2. Análisis multivariado
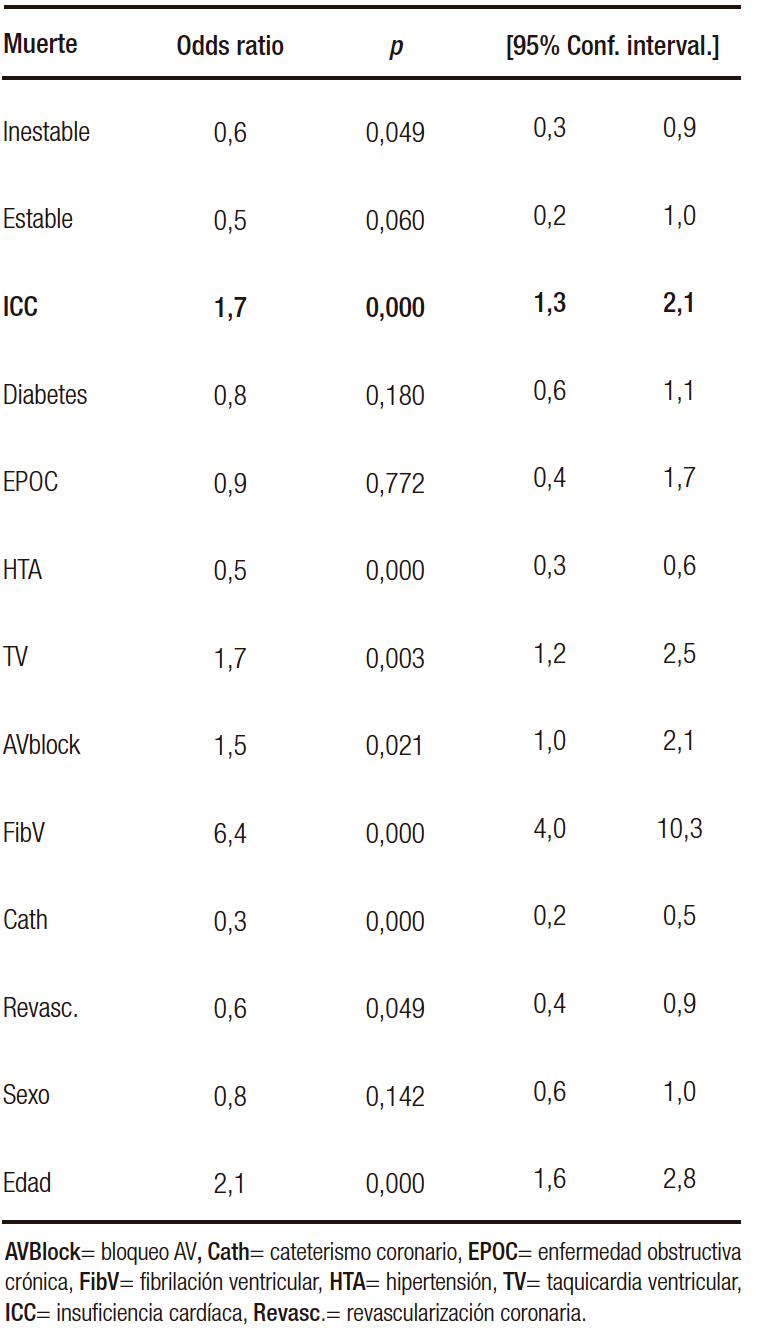
Lo que puede analizarse de este cuadro es que los pacientes con ICC post-IAM presentan un riesgo elevado de muerte (1,7/1 en relación con los que no padecieron ICC) y esto es independiente de las demás variables, lo que significa que tiene peso propio.
Podría haberse realizado un análisis estratificado por múltiples variables.
Este tipo de análisis permite valorar el efecto de un factor de riesgo sobre el evento mientras la otra variable permanece constante.
Consideremos la relación de la edad con la ICC en el impacto de la mortalidad post-IAM como se muestra en la Tabla 3.
Tabla 3. Análisis bivariado: edad e ICC en relación al evento

La presencia de ICC post-IAM incrementa el riesgo de muerte independientemente de la edad, ya que en el estrato de menor o igual 75 años, el riesgo es de 2,7 /1, y en los mayores de 75 años el riesgo es de 1,66 /1. A pesar de la edad, el riesgo persiste elevado.
Este tipo de análisis estratificado tiene sus limitaciones: debiéramos estratificar por cada una de las variables presentes en el estudio; con cada estratificación que agregamos, incrementamos el número de subgrupos para evaluar individualmente la relación de ICC y muerte en el IAM.
Así, en algunos subgrupos, habrá un número de pacientes insuficiente, aun comenzando con tamaños muestrales grandes.
Por lo tanto, solo evaluamos la ICC y la ajustamos a la edad, donde el riesgo de ICC es independiente de la edad, pero no la ajustamos a las demás variables que son importantes en la evolución del IAM.
El análisis multivariado resuelve esta limitación, ya que permite evaluar simultáneamente el impacto de múltiples variables en el resultado.
A continuación, enunciaremos los usos más comunes del análisis multivariado:
1. Identificar factores pronósticos, ajustando por potenciales confundidores: si bien los análisis multivariados son herramientas para el ajuste por potenciales confundidores, no hay que asumir que, si se realiza este modelo, se elimina por completo el sesgo de ese confundidor. Ningún ajuste es perfecto, dado que estos modelos presentan errores y, a su vez, pueden omitirse variables importantes, incorrectamente especificadas o interacciones entre las variables que no tomamos en cuenta.
2. Ajustar por las diferencias en las características basales: cuando la aleatorización es imposible, el uso del análisis multivariado aproxima estadísticamente una comparación de grupos “similares”.
3. Determinar modelos pronósticos: los modelos pronósticos proveen una válida estimación del riesgo solo en pacientes con características similares a la población estudiada.
4. Determinar modelos diagnósticos: los modelos multivariados pueden identificar la mejor combinación de información diagnóstica para una persona con una enfermedad en particular.
Ejemplo 2
En el siguiente ejemplo se analiza si el reflujo gastroesofágico (RGE) es un factor de riesgo para el adenocarcinoma de esófago sobre la base del siguiente artículo científico: N Engl J Med. 1999;340(11):825-31.
Diseño
Caso control, aparedos por edad y sexo en estratos por diez años. Es un diseño cuya dirección va del caso (cáncer) al predictor (RGE), ya que los autores recolectaron a pacientes con cáncer e identificaron cuántos padecieron síntomas típicos de RGE durante los cinco años previos.
Metodología
– Identificación minuciosa y uniforme de los casos representados por pacientes con cáncer esofágico (adenocarcinoma de esófago, adenocarcinoma del cardias y carcinoma escamoso de esófago).
– Controles poblacionales: aparedos por edad y sexo, seleccionados en forma aleatoria de un registro representativo de la población de Suecia. Además, se tomaron como controles pacientes con carcinoma epidermoide de esófago.
– Casos: fueron seleccionados en centros de cirugía y de un registro nacional de cáncer de Suecia, para tratar de reclutar la mayor parte de los pacientes con tumores de esófago (adenocarcinoma).
Análisis
Univariado y multivariado por regresión logística (expresado a través del “odds ratio”, que nos indica la relación de riesgo).
Se ajustó en el análisis por once potenciales confundidores (que los autores estimaron relevantes para identificar la independencia de la variable en estudio [RGE] con relación al resultado [cáncer de esófago]).
Resultados
La Tabla 1 expresa las características de la población global en estudio (edad, sexo, consumo de tabaco, de alcohol, nivel de educación) que, según los autores, adquieren relevancia en relación con esta patología.
La Tabla 4 expresa el riesgo de los síntomas de RGE en una semana o por la noche en una semana (esta tabla indica el predictor que estamos evaluando en relación con el evento).
Ejemplo Tabla 4 (véase en el texto)

El análisis es univariado, ya que es una sola variable (reflujo) en relación con el evento (cáncer).
Una primera mirada a la Tabla 2 la focalizamos en los controles (entre un 84-92% no padecen síntomas de reflujo), que nos muestra una elección adecuada de estos.
En una segunda interpretación en la que en los diferentes subgrupos de cáncer se expresa una relación entre no padecer síntomas (Odds ratio = 1 [grupo comparativo]) y presentar estos síntomas (cuántas veces se eleva el riesgo de cáncer al presentarlos vs. no padecerlos).
Si vamos al texto, se presenta como OR:1 (en controles y casos que no tienen síntomas) y un OR de
7,7 (5,3-11,4) en aquellos que los presentan.
Los pacientes que presentan síntomas de reflujo tienen siete veces más riesgo de cáncer de esófago que aquellos que no presentan síntomas de RGE.
No obstante, este análisis es solo de la variable en cuestión versus el evento; sin embargo, hay otras variables confundidoras de esta relación que los autores habían preestablecido.
Por consiguiente, realizaron un análisis multivariado (Tabla 3) en el que el OR no ajustado (univariado) del síntoma de RGE para el riesgo de adenocarcinoma esofágico es de 7,5 (el intervalo de confianza [IC]:5,4-10,6); el de adenocarcinoma del cardias gástrico es de 2,0 (IC: 1,5-2,8), y el de carcinoma escamoso de esófago, de 0,9 (IC: 0,6-1,4).
Presentar síntomas típicos de RGE representa un riesgo elevado de padecer adenocarcinoma de esófago y de cardias gástrico (IC no pasa por el valor 1), pero no de carcinoma escamoso (el IC pasa por el valor de nulidad).
En esta tabla 5, por debajo del valor no ajustado se describen otras variables potencialmente confundidoras de esta relación (RGE y cáncer).
Tabla 5. Valor no ajustado y ajustado por potenciales confundidores de la relación del reflujo RGE y el cáncer
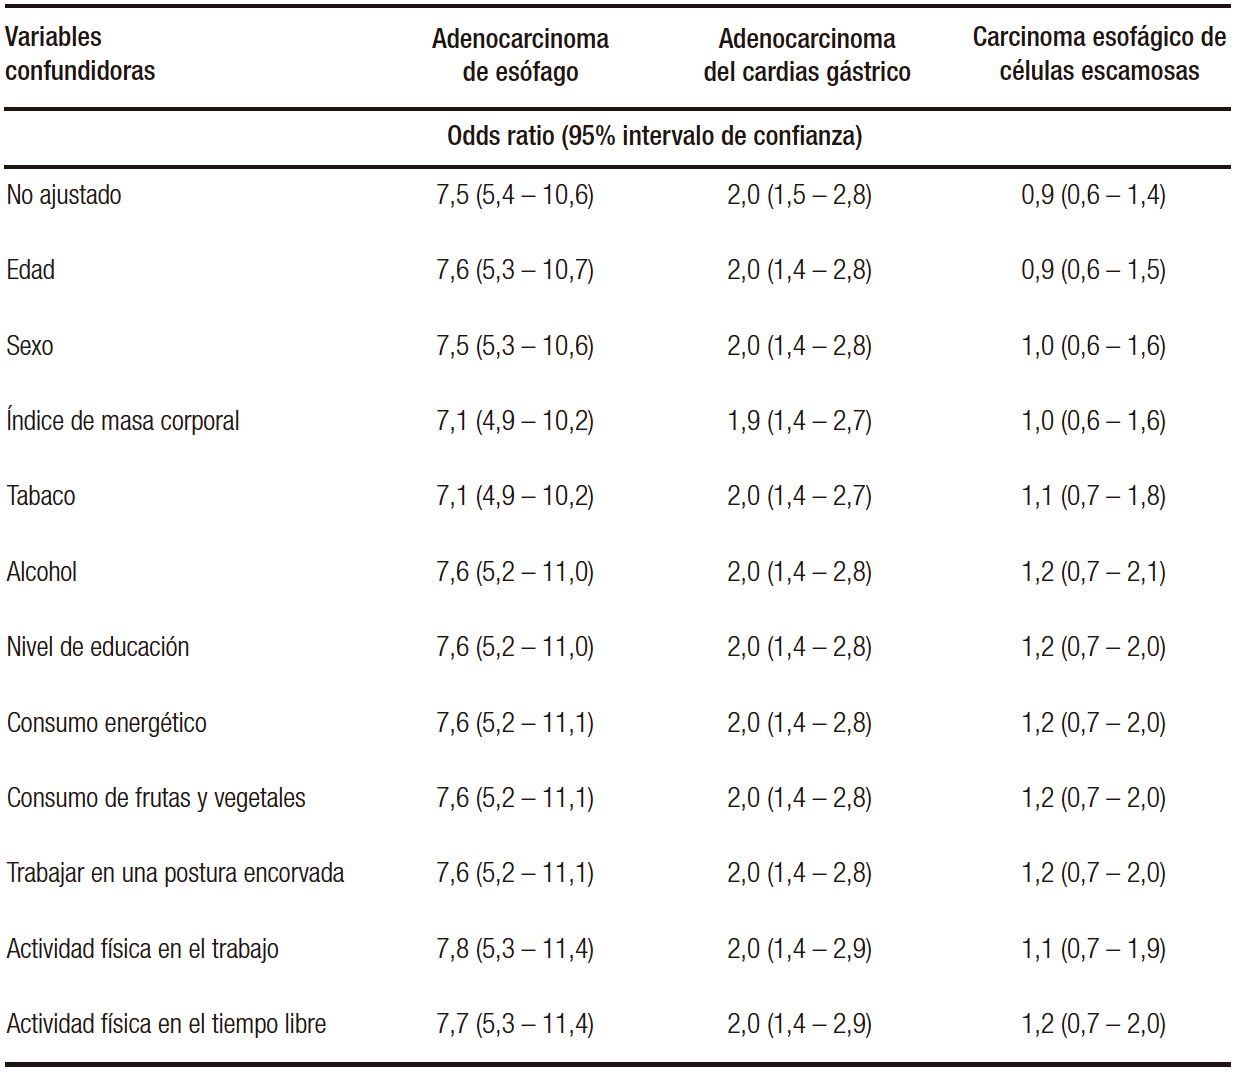
Estas variables potencialmente confundidoras (once en total) se enuncian con su respectivo OR, que no es el de la variable en cuestión, sino cómo hacen variar el OR no ajustado del reflujo GE en relación con las neoplasias; así, la edad no hace variar el OR no ajustado para el carcinoma de esófago (7,6 con la edad vs. 7,5 no ajustado), cuando incorporamos el sexo no varía el OR y así sucesivamente hasta llegar a la última variable (actividad física durante el esparcimiento), que no hace variar el OR e incorpora todas las demás.
Es decir, no se confunde la relación del RGE con el adenocarcinoma de esófago, tomando estas once variables.
En relación con el adenocarcinoma de cardias, la relación tampoco se altera, estimando el riesgo en dos veces más que en aquellos que no presentaron reflujo de forma independiente (no está confundida la relación por las demás variables).
En relación con el carcinoma escamoso, en el OR no ajustado, no hay relación con el RGE y esta no asociación se mantiene aun con los potenciales confundidores.
En resumen, el estudio demostró el riesgo mayor de adenocarcinoma de esófago y de cardias con el RGE. La relación de riesgo fue mayor para el adenocarcinoma de esófago.
No está confundida esta relación por las otras variables (valor independiente).
El RGE no es un factor de riesgo del carcinoma de células escamosas.
Las fortalezas del estudio son:
1. Estudio caso control con una adecuada selección del caso y un apareamiento de los controles por edad y sexo.
2. Se realizó un análisis por potenciales confundidores biológicamente vinculados a la patología en cuestión.
Las debilidades del estudio son:
1. En un estudio caso control hay que tener en cuenta los sesgos de recolección de datos (fueron adecuadamente extraídos de bases validadas; siempre está la posibilidad de tener una información no del todo completa de los casos).
2. Se establecieron 11 potenciales confundidores, pero uno puede inferir que puede haber otros no incluidos que hubiera que incorporar (en esto el estudio aleatorizado ajusta y equipara por potenciales confundidores conocidos y desconocidos a diferencia de los observacionales).
Este trabajo muestra en forma definitiva la relación causal entre el adenocarcinoma de esófago y la enfermedad por reflujo.
Propiedad intelectual. El autor declara que los datos y las tablas presentes en el manuscrito son originales y fueron realizados en su institución perteneciente.
Financiamiento. El autor declara que no hubo fuentes de financiación externas.
Conflicto de interés. El autor declara no tener conflictos de interés en relación con este artículo.
Aviso de derechos de autor
 © 2022 Acta Gastroenterológica Latinoamericana. Este es un artículo de acceso abierto publicado bajo los términos de la Licencia Creative Commons Attribution (CC BY-NC-SA 4.0), la cual permite el uso, la distribución y la reproducción de forma no comercial, siempre que se cite al autor y la fuente original.
Cite este artículo como: Pérez de Arenaza D. Análisis multivariado. Acta Gastroenterol Latinoam. 2022; 52 (2): 115-119. https://doi.org/10.52787/agl.v52i2.206
Referencias
- Mitchell H. Katz. Multivariable Analysis: A Practical Guide for Clinicians and Public Health Researchers. CAMBRIDGE UNIVERSITY PRESS. ISBN: 9780521760980.
- Charles Hennekens and Julie E. Buring, Epidemiology in Medicine. Lippincott Williams and Wilkins. ISBN: 9780316356367.
- Lagergren J, Bergström R, Lindgren A, Nyrén O. Symptomatic gastroesophageal reflux as a risk factor for esophageal adenocarcinoma. N Engl J Med. 1999 Mar 18;340(11):825-31
Correspondencia: Diego Pérez de Arenaza
Correo electrónico: diego.perezdearenaza@hospitalitaliano.org.ar
Acta Gastroenterol Latinoam 2022;52(2):115-119
Multivariate Analysis
Diego Pérez de Arenaza ID
Head of Cardiovascular Imaging Section, Cardiology Department, Hospital Italiano de Buenos Aires.
City of Buenos Aires, Argentina.
Acta Gastroenterol Latinoam 2022;52(2):120-124
Received: 03/05/2022 / Accepted: 05/06/2022 / Published online: 27/06/2022 / https://doi.org/10.52787/agl.v52i2.206

Many medical, political and social events have multiple causes, many of them related to each other.
Multivariate analysis is a statistical tool to determine the relative contribution of different causes to a given event or outcome. Clinical researchers need this type of analysis, since diseases have multiple causes and prognosis is usually determined by a large number of factors.
This type of analysis will be applied in two clinical scenarios by means of two examples.
Example 1
Coronary heart disease is associated with several factors, such as smoking, arterial hypertension, dyslipidemia, diabetes and coronary history, which are associated with acute myocardial infarction.
It should be noted that these factors do not cause myocardial infarction, but are associated with it.
Causality is based on biological plausibility and rigorous study designs, such as randomized trials which eliminate potential sources of bias.
However, the identification of risk factors associated with the event through observational studies, is particularly important, since it is impossible to randomize people with different conditions that cause myocardial infarction.
In turn, these conditions are associated together, since a smoker patient can be hypertensive and have a coronary history.
In our acute myocardial infarction (AMI) database, the objective is to assess whether heart failure (CHF) is independently associated with death in this patient population.
What we want to know is whether CHF during hospitalization independently contributes to mortality in acute myocardial infarction.
Table 1 compares the characteristics of the patients who died vs. those who survived post-AMI.
Table 1. Baseline Characteristics of Patients with AMI

We can see that there are many differences between the groups: patients who died were older, had a higher percentage of CHF, episodes of ventricular tachycardia, AV block and ventricular fibrillation.
Table 1 shows that patients with post-AMI CHF have higher mortality compared to those who do not (51% vs. 28%).
However, it does not answer the initial question about the independent contribution of the CHF, since it only analyzes the relationship of the variable with the event (univariate analysis) and not with the other factors in the study.
Therefore, we need multivariate analysis to answer the question at hand.
Table 2 presents the results of the multivariate analysis in which the weight of this variable is adjusted with the other factors.
Table 2. Multivarite Analysis
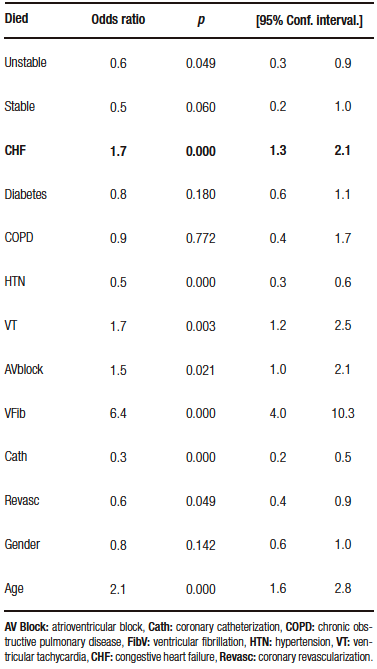
What can be analyzed from this table is that patients with post-AMI CHF have an elevated risk of death (1.7/1 compared to those who did not suffer CHF) and this is independent of the other variables, which means it has its own weight.
A multivariable stratified analysis could have been performed.
This type of analysis allows the effect of one risk factor on the event to be assessed while the other variable remains constant.
Let us consider the relationship of age with CHF in the impact of post-AMI mortality as shown in Table 3.
Table 3. Bivariate analysis age and ICC in relation to the event

The presence of post-AMI CHF increases the risk of death regardless of age, since in the stratum of less than or equal to 75 years, the risk is 2.7/1, and 1.66/1 in those older than 75 years. Despite age, the risk remains elevated.
This type of stratified analysis has its limitations: we should stratify by each of the variables present in the study, with each stratification we add, we increase the number of subgroups to individually assess the relationship of CHF and death in AMI.
Thus, in some subgroups, there will be an insufficient number of patients even starting with large sample sizes.
Therefore, we only assessed CHF and adjusted for age, where the risk of CHF is of age, but we did not adjust for the other variables that are important in the evolution of AMI.
Multivariate analysis resolves this limitation, as it allows the impact of multiple variables on the outcome to be assessed simultaneously.
The following are the most common uses of multivariate analysis:
1. Identify prognostic factors, adjusting for potential confounders: Although multivariate analyses are tools for adjusting for potential confounders, it should not be assumed that, if this model is performed, the bias of that cofounder is eliminated. No adjustment is perfect, since these models have errors and, in turn, may omit important and incorrectly specified variables or interactions between them that we do not consider.
2. Adjusting for differences in baseline characteristics: When randomization is impossible, the use of multivariate analysis statistically approximates a comparison of «similar» groups.
3. Determine prognostic models: Prognostic models provide a valid estimate of risk only in patients with similar characteristics to the population studied.
4. Determine diagnostic models: Multivariate models can identify the best combination of diagnostic information for a person with a particular disease.
Example 2
The following example discusses whether gastroesophageal reflux (GER) is a risk factor for adenocarcinoma of the esophagus based on the following article: N Engl J Med. 1999;340(11):825-31.
Design
Case control matched by age and sex in strata for 10 years: it is a design whose direction goes from the case (cancer) to the predictor (GER), as the authors collected patients with cancer and identified how many had typical GER symptoms during the previous five years.
Methodology
– Thorough and uniform identification of cases represented by patients with esophageal cancer (adenocarcinoma of the esophagus, adenocarcinoma of the cardia and squamous cell carcinoma of the esophagus).
– Controls matched by age and sex, randomly selected from a population registry representative of the Swedish population. In addition, patients with squamous cell carcinoma of the esophagus were taken as controls.
– Cases: they were selected from surgery centers and from a national cancer registry in Sweden, in an attempt to recruit the the majority of patients with esophageal tumors (adenocarcinoma).
Analysis
Univariate and multivariate by logistic regression (expressed through the «odds ratio» which indicates the risk ratio).
The analysis was adjusted for eleven potential confounders (which the authors considered relevant to identify the independence of the variable under study [GER] in relation to the outcome [esophageal cancer]).
Results
Table 1 shows the characteristics of the overall study population (age, sex, smoking, alcohol consumption and level of education) which, according to the authors, are relevant in relation to this pathology.
Table 4 expresses the risk of GER symptoms in one week or at night in one week (this table indicates the predictor that we are evaluating in relation to the event).
The analysis is univariate, since it is a single variable (reflux) in relation to the event (cancer).
A first look at Table 2 focuses on the controls (84%-92% do not have reflux symptoms), which shows an appropiate choice of controls.
In a second interpretation, a relationship is expressed, in the different cancer subgroups, between not having symptoms (Odds ratio=1 [comparative group]) and presenting these symptoms (how many times the risk of cancer is increased by presenting the symptoms vs. not having them).
If we look at the text, it is presented as OR:1 (in controls and cases that do not have symptoms) and an OR of 7.7 (5.3-11.4) in those who do.
Example table 4 (see in text)
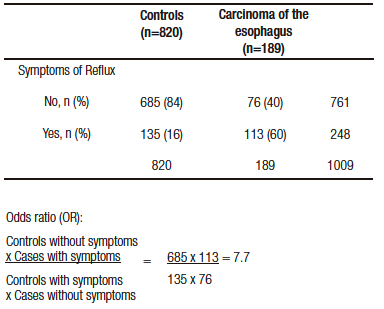
Patients with reflux symptoms have a seven times higher risk of esophageal cancer than those without GER symptoms.
However, this analysis is only of the variable in question versus the event. There are other confounding variables in this relationship that the authors had pre-established.
Therefore, they performed a multivariate analysis (Table 3) where the unadjusted (univariate) OR of GER symptom for risk of esophageal adenocarcinoma is 7.5 (confidence interval [CI]: 5.4-10.6); that of adenocarcinoma of the gastric cardia is 2.0 (CI: 1.5-2.8); and that of squamous cell carcinoma of the esophagus is 0.9 (CI: 0.6-1.4).
Presenting symptoms typical of GER represents a high risk of esophageal and gastric cardia adenocarcinoma (CI does not go through the value 1), but not of squamous cell carcinoma (the CI goes through the null value).
In this table 5, below the unadjusted value, other potentially confounding variables of this relationship (GER and cancer) are described.
Table 5. Unadjusted and adjusted value for potential confounders of the relationship of GE reflux and cancer
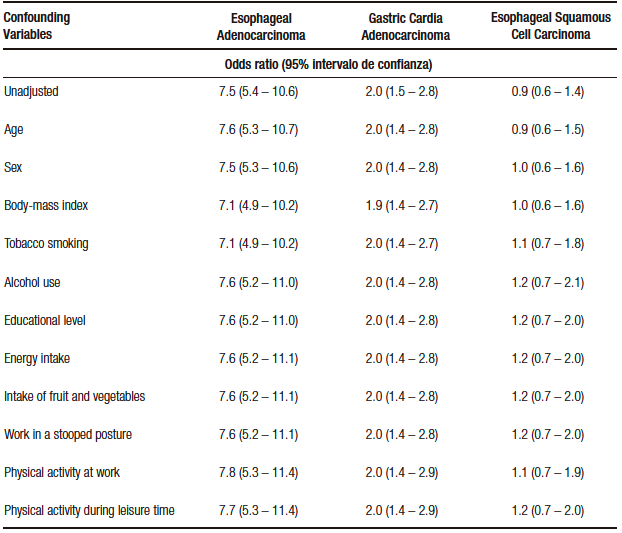
These potentially confounding variables (eleven in total) are stated with their respective OR, which is not that of the variable in question, but how they make the unadjusted OR of GER vary in relation to neoplasms; thus, age does not change the unadjusted OR for esophageal carcinoma (7.6 with age vs. 7.5 unadjusted), when we incorporate sex the OR does not vary and so on until we reach the last variable (physical activity during recreation), whichdoes not vary the OR and incorporates all the others.
In other words, the relationship between GER and esophageal adenocarcinoma is not confused, taking these eleven variables.
In relation to adenocarcinoma of the cardia, the relationship is not altered either, estimating the risk to be twice as high as in those who did not present reflux independently (the relationship is not confounded by the other variables).
In relation to squamous cell carcinoma, in the unadjusted OR, there is no relationship with GER and this no- association is maintained even with the potential confounders.
In summary, the study demonstrated the increased risk of esophageal adenocarcinoma and cardia with GER. The risk ratio was higher for adenocarcinoma of the esophagus.
This relationship is not confounded by the other variables (independent value).
GER is not a risk factor for squamous cell carcinoma.
The strengths of the study are:
1. Case-control study with adequate case selection and matching of controls by age and sex.
2. An analysis by potential confounders biologically linked to the pathology in question was performed.
Weaknesses of the study are:
1. In a case-control study, data collection biases must be taken into account (the data were adequately extracted from validated databases; there is always the possibility of having incomplete information on the cases).
2. Eleven potential confounders were established, but one can infer that there may be others not included that should be incorporated (in this the randomized study adjusts and equates for known and unknown potential confounders, unlike observational studies).
This study definitively shows the causal relationship between adenocarcinoma of the esophagus and reflux disease.
Intellectual Property. The author declares that the data and tables that appear in this manuscript are original and were made in his belonging institution.
Funding. The author states that there were no external funding sources.
Conflict of interest. The author declares that he has no conflicts of interest in relation to this article.
Copyright
© 2022 Acta Gastroenterológica latinoamericana. This is an open-access article released under the terms of the Creative Commons Attribution (CC BY-NC-SA 4.0) license, which allows non-commercial use, distribution, and reproduction, provided the original author and source are acknowledged.
Cite this article as: Pérez de Arenaza D. Multivariate Analysis. Acta Gastroenterol Latinoam. 2022;52(2):120-124. https://doi.org/10.52787/agl.v52i2.206
References
- Katz M. H. Multivariable Analysis: A Practical Guide for Clinicians and Public Health Researchers. CAMBRIDGE UNIVERSITY PRESS. ISBN: 9780521760980.
- Hennekens C., Buring J. E. Epidemiology in Medicine. Lippincott Williams and Wilkins. ISBN: 9780316356367.
- Lagergren J, Bergström R, Lindgren A, Nyrén O. Symptomatic gastroesophageal reflux as a risk factor for esophageal adenocarcinoma. N Engl J Med. 1999 Mar 18;340(11):825-31
Correspondence: Diego Pérez de Arenaza
Email: diego.perezdearenaza@hospitalitaliano.org.ar
Acta Gastroenterol Latinoam 2022;52(2):120-124